Setup Azure Application Insights for a .NET Core API 8 application

Create an Application Insights Resource in Azure:

– Go to the Azure portal, “Create a resource”, search for “Application Insights” and create.

Install the Application Insights SDK in Your .NET Core 8 Project:

– Open your .NET Core API project.

– Install the `Microsoft.ApplicationInsights.AspNetCore` NuGet package

Configure Application Insights in Your Project:

– Open the `appsettings.json` file and add your Application Insights Instrumentation Key:

{
       "ApplicationInsights": {
         "InstrumentationKey": "your_instrumentation_key_here"
       }
}

The instrumentation key can be found in azure portal on the application insight resource “Overview tab”, the label “Instrumentation Key” in top right.

– Alternatively, you can set the instrumentation key in the environment variables.

Add the Application Insights telemetry

Modify the `Program.cs` file:

using Microsoft.ApplicationInsights.Extensibility;
...

// Add Application Insights telemetry
builder.Services.AddApplicationInsightsTelemetry();

// Configure logging to include Application Insights
builder.Logging.AddApplicationInsights();

//Write log message
var logger = builder.Services.BuildServiceProvider().GetRequiredService<ILogger<Program>>();
logger.LogInformation("Logging init");
...

var app = builder.Build();
//Write log message to indicate logging is working
app.Logger.LogInformation("Logging init");
...

Set logging level to information and add logging message:

Default logging level for Application Insights logger is “warning”, here is how to change the level to include “information” as well.

Method 1
: in appsettings.json file:

{
...
  "Logging": {
    "LogLevel": {
...
    },
    "ApplicationInsights": {
      "LogLevel": {
        "Default": "Information",
        "Microsoft": "Warning",
        "Microsoft.Hosting.Lifetime": "Information"
      }
    }
  }
}

Method2: Configure Logging Level in Program.cs

// Add Application Insights telemetry
builder.Services.AddApplicationInsightsTelemetry();

// Configure logging to include Application Insights
builder.Logging.AddApplicationInsights();

// Set the logging level to Information
builder.Logging.AddFilter<Microsoft.Extensions.Logging.ApplicationInsights.ApplicationInsightsLoggerProvider>("", LogLevel.Information);

Verify Telemetry Collection logging

– Run your application, the logging “Logging init” should have been logged.

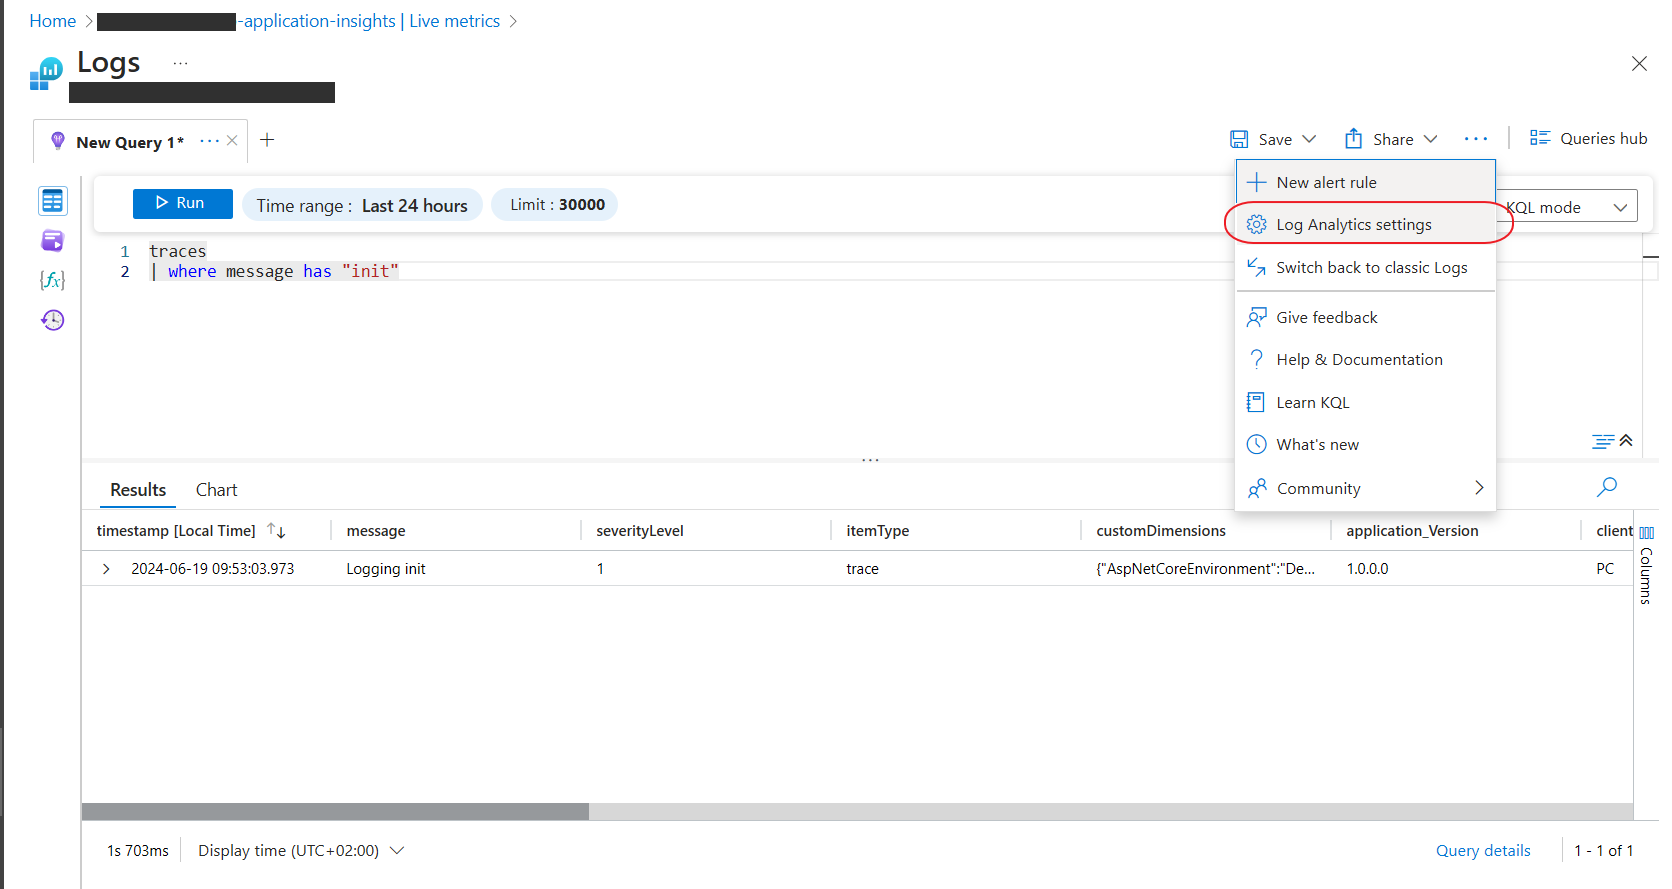
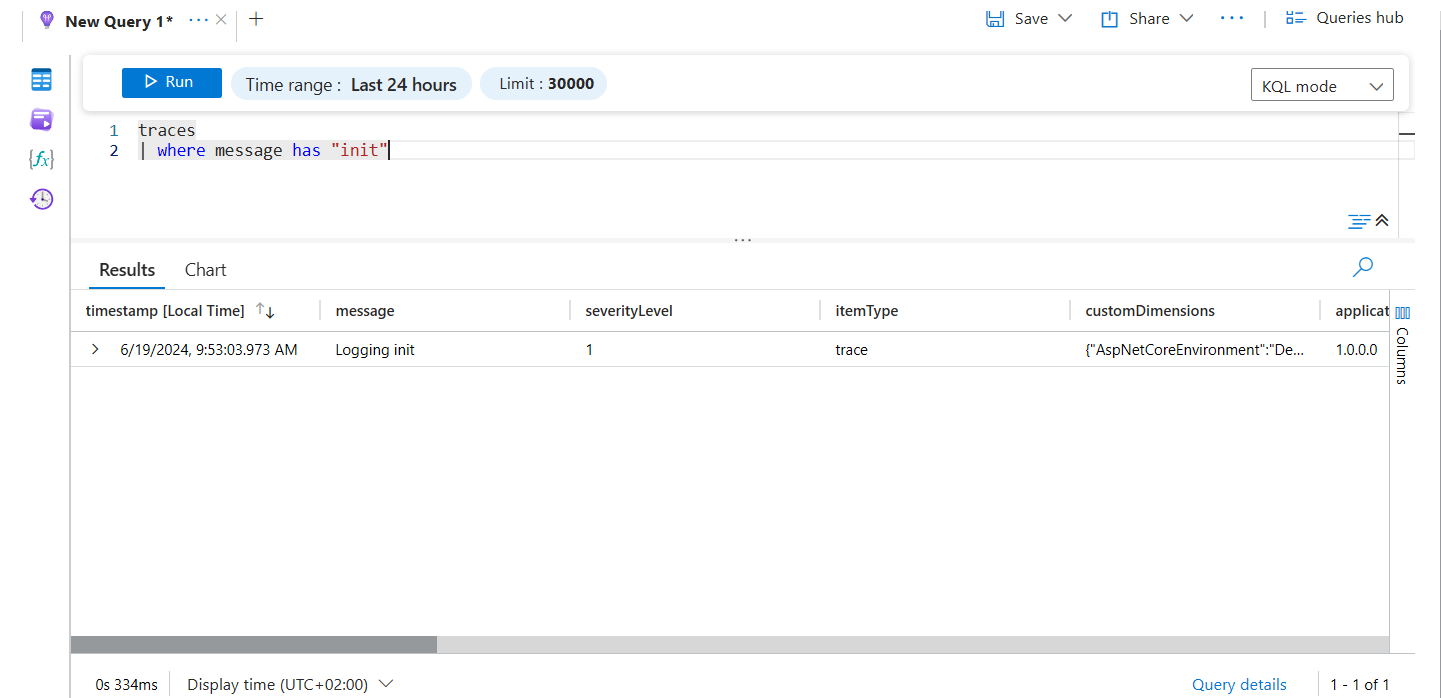
– Go back to the Azure portal, navigate to your Application Insights resource, and check the “Live Metrics Stream” or “Logs” to verify that telemetry data  is being collected. E.g. filter for “traces” in the query and the “Logging init” LogInformation() call should be present.

Example log query:

traces 
 | where message has "init"

Example of more advanced log query:

traces
| where timestamp > ago(2h) // Adjust the time range as needed
| where severityLevel >= 1 // 1 corresponds to Information level and above
| project timestamp, message, severityLevel
| order by timestamp desc

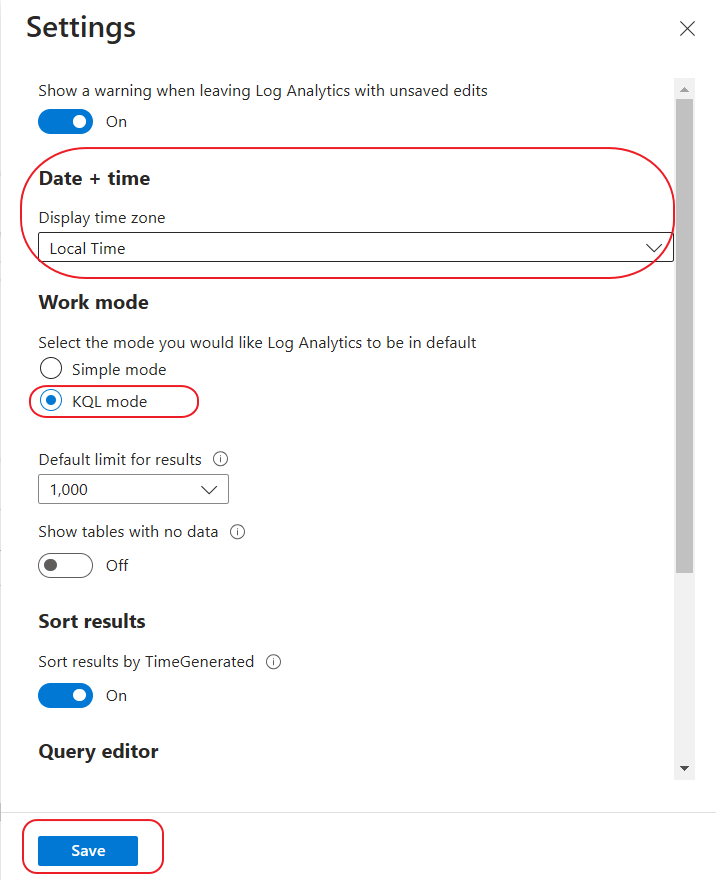
Set the timestamp presentation to Swedish time

If you are in non English country you might want to change the time presentation and the local time zone default settings.

Set regional format for Azure Portal:
Click the user menu in top right: select “View account”:

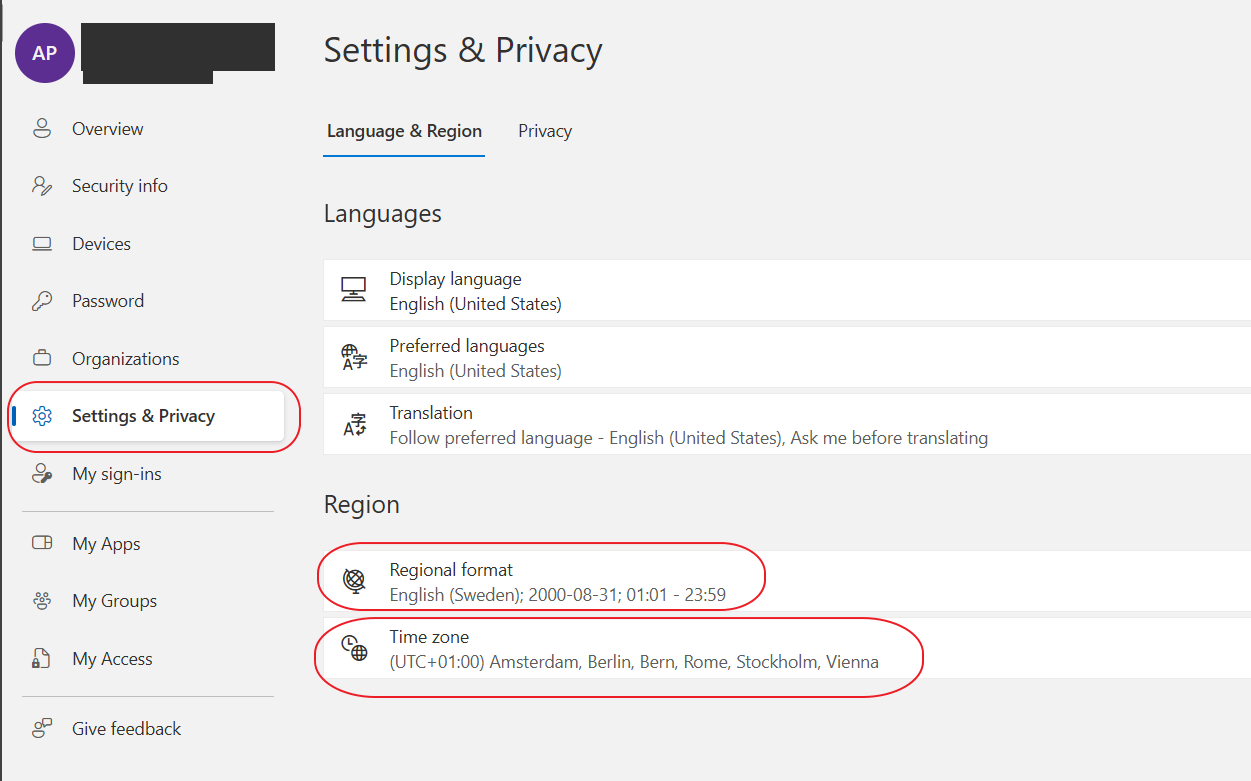
Select “settings..” tab, set regional format and time zone.

Set local time zone as default for the log view:


Clean Architecture in .NET

Layers in Clean Architecture

Summary

Jason Taylor gives a superb explanation of Clean Architecture on this clip.

Domain and Application are central to the design. It’s the core of the system.

Presentation and Infrastructure belong to the outermost layer and are not dependent on each other. They only depend on Application.

Application only depends on Domain.

Domain has no dependencies.

Source: Clean Architecture. Jason Taylor gives a superb explanation… | by Oscar Olsson | Medium

C# .NET – Generate error message when “async void” is used in code

The mentioned AsyncFixer extension and Nuget Package are super useful when dealing with async code. They both package a Roslyn analyzer that detects many async issues and provides an automatic fix for them as well in most cases. Using the .editorconfig in Visual Studio you can configure specific warnings as errors:
[*.cs] # AsyncFixer03: Fire-and-forget async-void methods or delegates dotnet_diagnostic.AsyncFixer03.severity = error
And you can set that straight from the Solution Explorer in case you’ve a

Source: c# – Generate error message when “async void” is used in code – Stack Overflow

Fluent Assertions Vs MS Test Assertions

I appreciate what fluent assertions have got to offer. Fluent Assertions have benefits of clear error messages, more readable test code and fewer lines of code needed for writing tests as iterated from the previous paragraph. The descriptive outcomes that Fluent Assertions offers also suits TDD and BDD testing methodologies.

Source: Fluent Assertions Vs MS Test Assertions

C# .net core how to get access to content file below bin\Debug\net6.0

In a .NET Core (now called .NET) application, you can access content files that are located below the bin\Debug\net6.0 (or bin\Release\net6.0 for release builds) directory using relative paths. The bin\Debug\net6.0 directory is the output directory where the compiled application and its associated files are located during development.

Here’s how you can access content files located below this directory:

  1. Set the Build Action for Content Files: First, make sure that the content files you want to access are marked with the appropriate build action. Right-click the file in Solution Explorer, go to Properties, and set the Build Action to “Content”. This ensures that the file gets copied to the output directory during the build process.
  2. Accessing Content Files: You can access content files using the System.IO namespace to manipulate file paths and read the content. Here’s an example of how you can read the content of a text file located below the bin\Debug\net6.0 directory:
using System;
using System.IO;

class Program
{
    static void Main()
    {
        string basePath = AppDomain.CurrentDomain.BaseDirectory;
        string contentFilePath = Path.Combine(basePath, "myfile.txt");

        if (File.Exists(contentFilePath))
        {
            string content = File.ReadAllText(contentFilePath);
            Console.WriteLine("Content of the file:");
            Console.WriteLine(content);
        }
        else
        {
            Console.WriteLine("File not found.");
        }
    }
}

In this example, AppDomain.CurrentDomain.BaseDirectory gives you the path to the directory where your executable is located (bin\Debug\net6.0), and then you use Path.Combine to form the full path to the content file you want to access.

Remember that this approach works well during development, but in a production scenario, the location of the content files might differ, so you should consider different strategies for handling content files in production deployments.

Source: Chat GPT, https://chat.openai.com

How do I store session data in Server-side Blazor?

First to access browser Session Storage in Blazor apps, write a custom code or use a third party package. The accessed data can be stored in the localStorage and sessionStorage.  The localStorage is scoped to the user’s browser. If the user reloads the page or closes and reopens the browser, the state persists. Session storage is similar to the local storage but the data in the session storage will be cleared after the session.

Source: How do I store session data in Server-side Blazor?

dnSpy – .NET debugger and assembly editor

dnSpy is a debugger and .NET assembly editor. You can use it to edit and debug assemblies even if you don’t have any source code available. Main features: Debug .NET and Unity assemblies Edit .NET and Unity assemblies Light and dark themes

Debugger

  • Debug .NET Framework, .NET and Unity game assemblies, no source code required
  • Set breakpoints and step into any assembly
  • Locals, watch, autos windows
  • Variables windows support saving variables (eg. decrypted byte arrays) to disk or view them in the hex editor (memory window)
  • Object IDs
  • Multiple processes can be debugged at the same time
  • Break on module load
  • Tracepoints and conditional breakpoints
  • Export/import breakpoints and tracepoints
  • Call stack, threads, modules, processes windows
  • Break on thrown exceptions (1st chance)
  • Variables windows support evaluating C# / Visual Basic expressions
  • Dynamic modules can be debugged (but not dynamic methods due to CLR limitations)
  • Output window logs various debugging events, and it shows timestamps by default 🙂
  • Assemblies that decrypt themselves at runtime can be debugged, dnSpy will use the in-memory image. You can also force dnSpy to always use in-memory images instead of disk files.
  • Public API, you can write an extension or use the C# Interactive window to control the debugger

Source: dnSpy/dnSpy: .NET debugger and assembly editor

.NET Core API endpoint model validation

Example of simple method in an API controller for showing invalid posted model state.

[HttpPost("create")]
public ActionResult<MyModel> Create([FromBody] MyModel model)
{
    ValidateIncomingModel();
    return myBusiness.Create(model);
}

private void ValidateIncomingModel()
{
    if (!ControllerContext.ModelState.IsValid)
    {
        var errors = ControllerContext.ModelState.Keys
              .SelectMany(key => ControllerContext.ModelState[key].Errors
              .Select(x => key + ": " + x.ErrorMessage));
        var message = string.Join("\n", errors);
        throw new Exception($"Not valid incoming model\n {message}");
    }
}


ClosedXML – .NET library for Excel files

ClosedXML is a .NET library for reading, manipulating and writing Excel 2007+ (.xlsx, .xlsm) files. It aims to provide an intuitive and user-friendly interface to dealing with the underlying OpenXML API.

Source: ClosedXML
License: MIT / Open source project
Doc: https://closedxml.readthedocs.io/en/latest/index.html
Wiki: https://github.com/closedxml/closedxml/wiki

ClosedXML is a wrapper of the offical .NET Open XML SDK:
https://github.com/dotnet/Open-XML-SDK

How to Deserialize JSON to C# cherry-picking a small portion of JSON data

JSON deserialization in C# refers to the process of forming up .NET objects from a JSON string. Most of the time, this means creating strongly-typed POCOs. However, there are certain situations when we may prefer flexibility over type-inference. For example, cherry-picking a small portion of JSON data, dealing with external JSON data whose structure is largely unknown or changes very often, etc. Dynamic deserialization comes into play for such cases. This does not necessarily mean the use of language’s inbuilt dynamic keyword. There are other ways as well.We are going to see how we can do this using the native System.Text.Json library and the popular Newtonsoft.Json library.

Source: How to Deserialize JSON Into Dynamic Object in C# – Code Maze