Fixing Webstorm cant debug in Chrome error: “Please ensure that the browser was started successfully with remote debugging port opened”

Error message in Jetbrains Webstorm:

Waiting for connection to localhost:59066. Please ensure that the browser was started successfully with remote debugging port opened. Port cannot be opened if Chrome having the same User Data Directory is already launched.

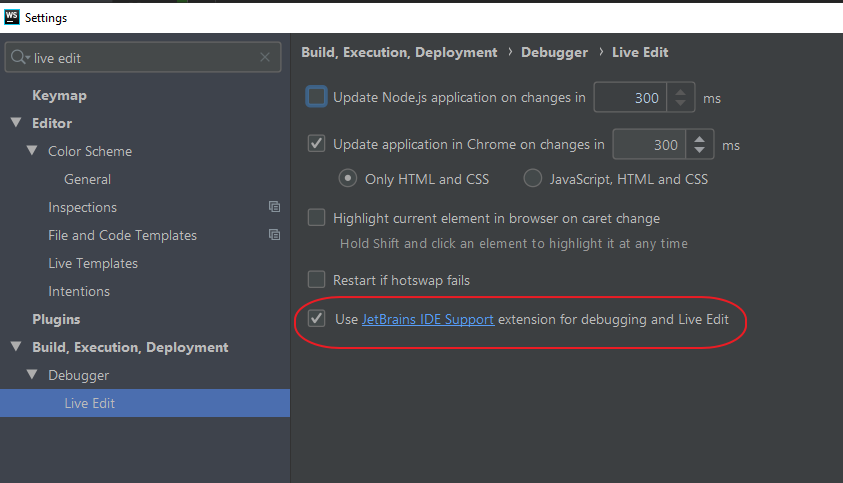
Can be fixed by installing the “jetbrains ide” chrome extension and make sure the above settings checkbox is active “Use JetBrains IDE support extension…”

Internet Explorer 11 and Angular 2+ – Agilix – Medium

IE 11 and Angular don’t always mix. I must say that there’s quite the support provided by the Angular dev team and community. But, there are things that really aren’t up for the Angular devs to fix.

I’ve created a small list of issues I’ve encountered when developing and Angular 5 application for an IE 11 client.

Source: Internet Explorer 11 and Angular 2+ – Agilix – Medium

Javascript debugging helper – Count number of eventlisteners in Chrome console

Paste and run one of the code blocks below in chrome console to get eventlisteners count.

//eventlisteners counter - grouped summary
Array.from(document.querySelectorAll('*'))  .reduce(function(pre, dom){
    var evtObj = getEventListeners(dom)
    Object.keys(evtObj).forEach(function (evt) {
      if (typeof pre[evt] === 'undefined') {
        pre[evt] = 0
      }
      pre[evt] += evtObj[evt].length
    })
    return pre
  }, {})
  
//_-------------------------------------------
  
  // //eventlisteners - totalcount
  var totalCount = 0;
  Array.from(document.querySelectorAll('*')).reduce(function(pre, dom){
    var evtObj = getEventListeners(dom)
    Object.keys(evtObj).forEach(function (evt) {
      if (typeof pre[evt] === 'undefined') {
        pre[evt] = 0
      }
      // pre[evt] += evtObj[evt].length
	  totalCount += evtObj[evt].length;
    })
    return totalCount;
  }, {})
  
  
  //---------------------------------------


How to set aliases in Git Bash for Windows?

For Windows 10 with Git Bash:
Edit file “%userprofile%\.bashrc”
Using Notepad++ or other text editor in Administrator mode.

Add another alias line beneath the present alias lines:

alias ls='ls --color=auto --show-control-chars -a -p --time-style=long-iso -h -X --group-directories-first'
alias ll='ls -l --color=auto --show-control-chars -a -p --time-style=long-iso -h -X --group-directories-first'
alias ngs='ng serve --open'
alias grep='grep -i -n --color=always'
alias log='git log --color --graph --pretty=format:'%Cred%h%Creset -%C(yellow)%d%Creset %s %Cgreen(%cr)%C(bold blue) <%an> %Creset' --abbrev-commit'

Above is an alias ngs for serving angular development server and open a web browser.
Instead of typing “ng serve –open” in Git bash window you should now be able to just use ngs as an shortcut alias.

How to include and use jQuery in Angular CLI project

Tested in angular version 7:

  1. install jquery:
    npm install jquery
    install jquery typescript intellisense:
    npm install @types/jquery
  2. edit the angular.json file in root folder:
    in the architect / build / scripts location, add this:

    "scripts": [ "./node_modules/jquery/dist/jquery.min.js" ]
  3. To use jquery inside a component.ts add this import at the top:
    import $ from ‘jquery’;

    Example code to check for functionality:
    component html:

    <button (click)="testJQuery()">Test jquery</button>
    component.ts:
    testJQuery() {
    $('html').fadeOut();
    $('html').fadeIn();
    }
    Click on the button should fade out and fade in the entire page.

Source: How to include and use jQuery in Angular CLI project

cors-proxy-server – npm

I wanted to try out some Angular code against a demo odata service, but when requesting data from another domain in a web browser (the angular context) you might get:

Access to XMLHttpRequest at ‘http://services.odata.org/V4/OData/OData.svc/Products?$format=json’ from origin ‘http://localhost:4200’ has been blocked by CORS policy: Response to preflight request doesn’t pass access control check: Redirect is not allowed for a preflight request.

To get around this problem you could use a node proxy like this one:

Source: cors-proxy-server – npm

Install and start it up. Now we can call the odata service by prepending the proxy url before the actual api endpoint like this:
http://localhost:9090/http://services.odata.org/V4/OData/OData.svc/Products

Notice the double http://

The entire CORS problem can be summarized like this:

The web browser will prevent javascript to get a response from the service at domain x if that server does not explicitly say its ok to respond the remote caller. In our case our source domain is ‘localhost’ and the services.odata.org haven’t added that as a valid domain to respond to according to the web browser.

More info regarding CORS here: https://developer.mozilla.org/en-US/docs/Web/HTTP/CORS

EPiServer Admin Import data – Fixing the Request timed out exception

If you are importing a big file of data into EPiServer through the admin import data feature, you might get this exception:

Exception Details: System.Web.HttpException: Request timed out.

ASP.NET has a timeout of 120 seconds by default, you can increase this setting for the admin section only using the following setting.

Add this directly under the location path admin / system.web element:

<httpRuntime executionTimeout="999999" maxRequestLength="2097151" />

E.g. in web.config:

...
<location path="epi/CMS/admin">
    <system.web>
      <httpRuntime executionTimeout="999999" maxRequestLength="2097151" /> 
      <authorization>
        <allow roles="WebAdmins, Administrators" />
        <deny users="*" />
      </authorization>
    </system.web>
  </location>
...

Source: https://support.microsoft.com/en-ca/help/925083/error-request-timed-out-when-you-try-to-upload-a-large-file-to-a-docum